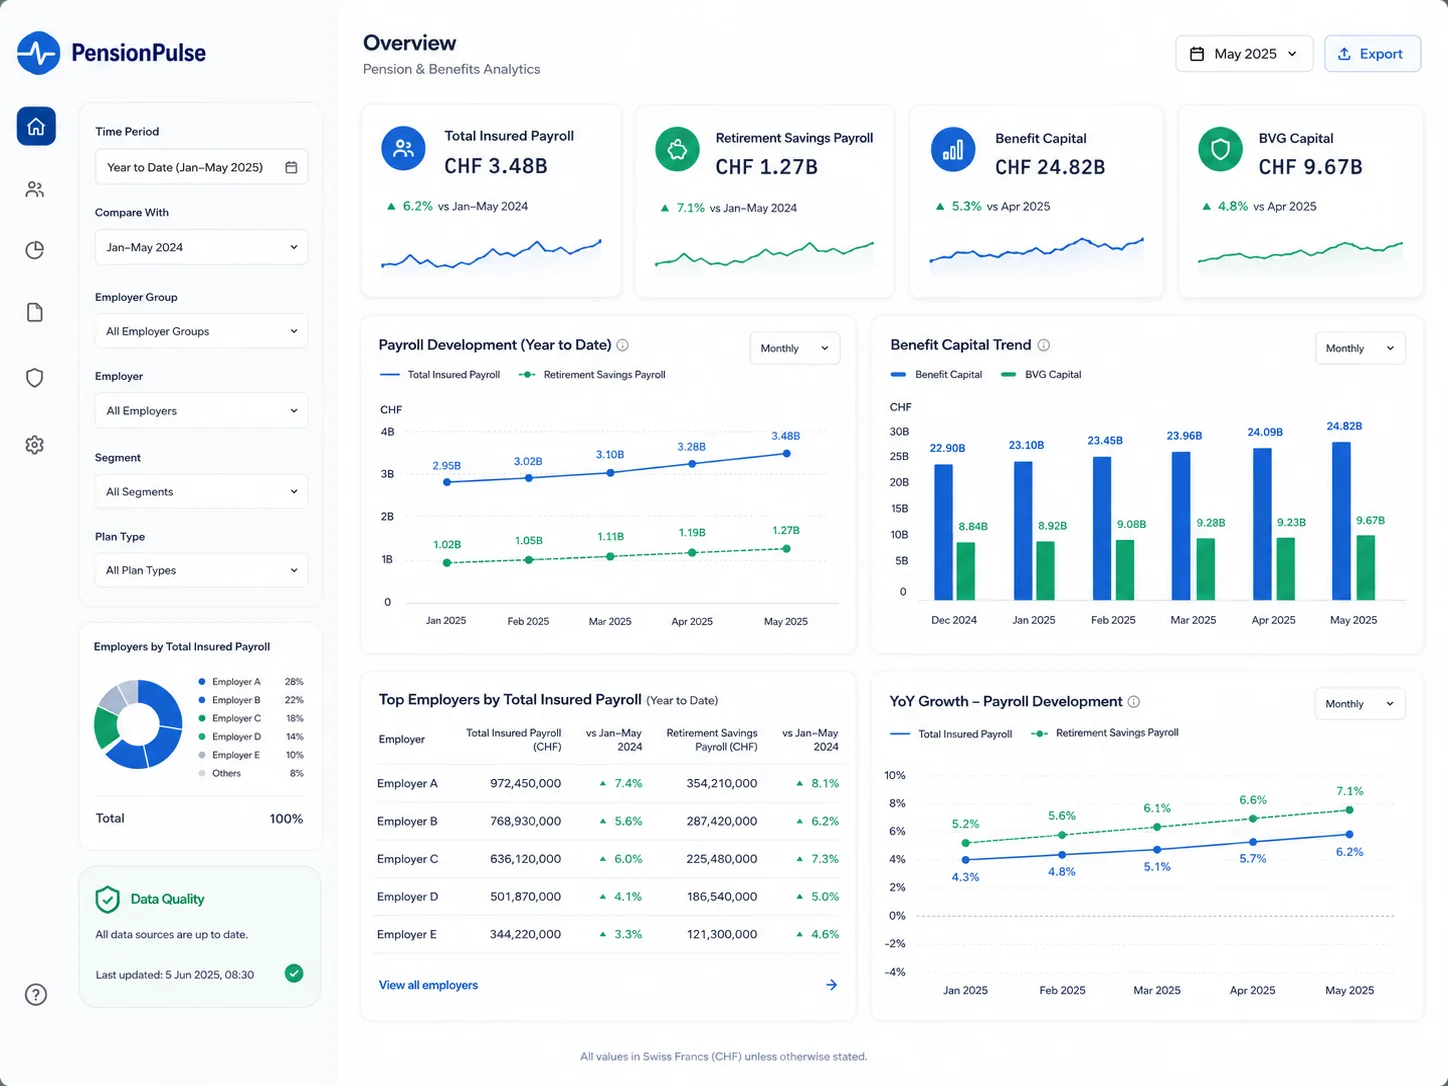
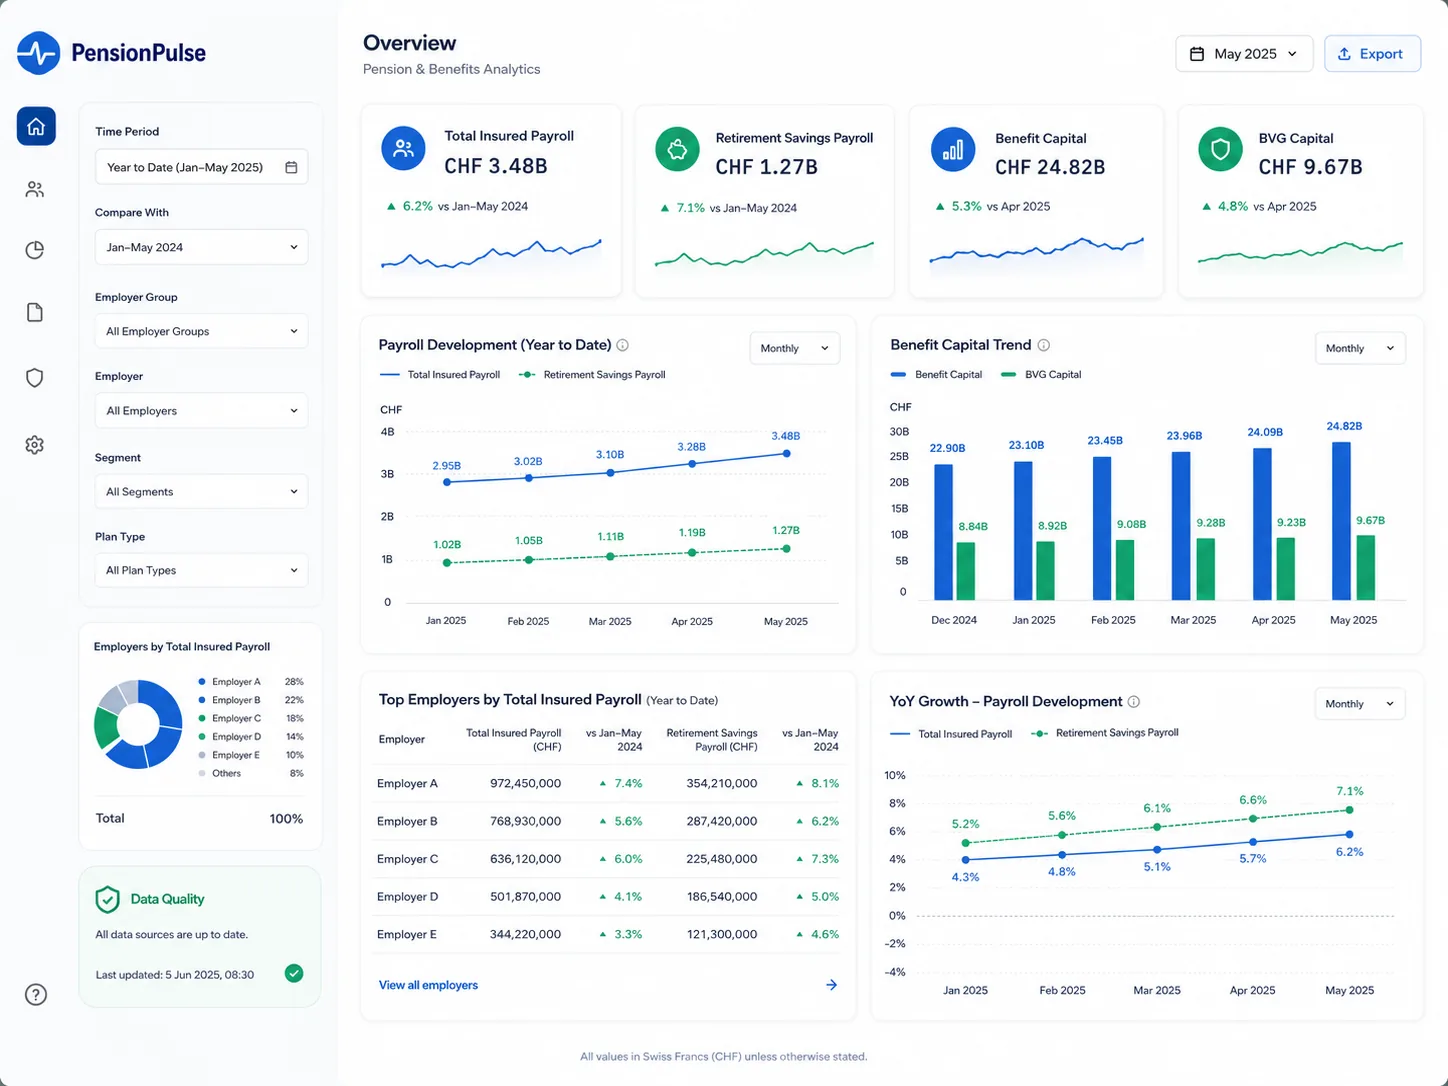
Is this your BI and reporting reality?
Every team has its own Excel reports; the numbers never quite match.
Data has to be compiled manually from several systems.
Changes to KPIs (e.g. margin, contribution) take weeks.
There is no clear single point of truth for management KPIs.
Does this sound familiar?
Request data assessmentAnalytics maturity model
- 1
Raw data
- 2
Cleansed & integrated data
- 3
Standard reports
What happened?
- 4
Ad-hoc analyses
Why did it happen?
- 5
Self-service BI
Scaled descriptive & diagnostic analytics
- 6
Predictive analytics
What will happen?
- 7
Prescriptive analytics
What should we do?
- 8
Human-machine interfaces & autonomous systems
Execute / assist
Where are you today in your data landscape?
Many companies sit somewhere between manual analysis, early BI structures and scalable data platforms. This short assessment helps identify your current position and the most useful next step.
Excel & reactive reporting
Reduce manual effort and create a first reliable set of figures.
Structured BI & scalable foundation
Consistent KPIs across teams and a scalable data structure.
ML & AI ready
A reliable data foundation at scale to move from what happened to what happens next.
- Build a central data foundation for the most important company data
- Define central structures (e.g. customers, products, sales, appointments)
- Historisation only where relevant for analysis
- Extend the central data foundation to further business areas
- Shared definitions so all teams work with the same figures
- Establish historisation and traceability as the standard
- Provide curated, documented data sets for business teams
- Ensure decisions can be traced back to the data source
- High standards for control and auditability
- Automate the most important manual exports and imports
- Connect core systems (e.g. ERP, CRM) to the data foundation
- Simple, traceable load processes instead of script sprawl
- Expand into robust ETL/ELT pipelines with quality assurance
- Orchestrate and monitor load processes
- Standardised patterns for new data sources
- Near-realtime connections where relevant to the business
- Automated data quality checks across all pipelines
- Scalable pipelines as the basis for ML & AI
- Replace central Excel reports with first dashboards
- Clear core KPIs for management and business teams
- Consistent reporting layout and permissions
- Management cockpits and standard reports per area
- Self-service analytics on validated data sets
- Governance for KPIs & permissions
- A consistent self-service culture without data chaos

- Forecasts & scenarios directly in dashboards


- A consolidated view across entities, countries and channels
- First clear responsibilities for central data
- Consistent definitions for the most important KPIs
- Simple rules for access and changes
- Data owners per domain and documented standards
- Aligned approval and change processes
- Connection to master data management (MDM)
- Data governance lived across all areas
- Automated quality & compliance controls
- Audit-proof traceability
Run the data maturity assessment.
Choose the option that best matches your reality today.
1 / 10
Question 1 / 10:
Where does reporting usually start for you?
Scoring: (each answer maps to a level)
A = Level 1 (foundations / mostly manual)
B = Level 2 (structured, but still developing)
C = Level 3 (scalable, automated & future-ready)
Tie-breaker rules: (in the event of a tie)
If question 6 = A → Level 1
If question 5 = C and question 8 = C → Level 3
In all other cases → Level 2
Our approach to BI & Data Analytics
We always see BI & data as an interplay of architecture, processes and adoption


Data Warehouse & Data Platform
- Design of the data model (facts & dimensions)
- Building a data warehouse or data lakehouse
- Historisation, slowly changing dimensions, audit trails


Data integration & ETL/ELT
- Extraction from operational systems (ERP, CRM, shop, specialist applications)
- Transformation using consistent business logic
- Loading into the data warehouse incl. quality assurance


Reporting & Dashboards
- Building standard reports & management cockpits
- Self-service analytics for business teams (e.g. Power BI)
- Governance for KPIs & permissions


Data governance & MDM integration
- Clear responsibilities for data & KPIs
- Connection to master data management (MDM)
- Guidelines for data quality & usage
Deep dive on master data
Master Data Management (MDM)Platform options & technology stacks
Depending on your starting point, governance requirements and target vision, we don't rely on one standard stack. We work with clear architecture variants that fit maturity, team, budget and long-term strategy.
Technology-open and dashboard-tool independent
For companies that want maximum openness and low dependency on a single vendor, we build an open data platform with lakehouse/warehouse logic, open-source components for ingestion and transformation, and a deliberately tool-independent consumption layer at the reporting level.
The data foundation stays stable even if dashboard or frontend tools change later.

Our BI projects are led by experienced specialists who know reporting, data modelling and platform architecture from practice. The team holds Databricks and Microsoft certifications and deep experience in building modern lakehouse and data platform architectures


Microsoft ecosystem, BI & Power BI enablement
Focus on KPI logic, reporting architecture, self-service BI and the clean connection between business, data model and governance.


Lakehouse, data engineering & platform architecture
Focus on medallion logic, data pipelines, data platform design and the technical foundation for scalable analytics and AI use cases.
Platforms & technologies we work with
We don't work tool-driven, but along your target vision, data maturity, governance requirements and long-term scalability.
Platforms & lakehouse


Transformation & data engineering


Storage & open formats


Reporting / BI / consumption layer


Depending on the starting point we build on Microsoft-centric platforms, lakehouse architectures or open data stacks. What always matters to us is that the data foundation stays cleanly structured, resilient and as tool-independent as possible at the reporting level.
We combine proven technologies for ingestion, transformation, storage, governance and consumption — from Microsoft Fabric and Power BI to Databricks and open lakehouse/warehouse components through to flexible dashboard and consumption layers.
This avoids unnecessary dependency on a single frontend or tool, and changes in the system landscape can be implemented with far less friction.
Finance & Controlling
Margin analyses, cashflow, scenarios & forecasts.
Operations & Supply Chain
Inventory, lead times, delivery reliability, bottlenecks.
Management Reporting
A consolidated view across entities, countries and channels.
Sales & Marketing
Pipeline transparency, campaign performance, customer journey.
How BI & data projects work with CONSENSO TECH
Data discovery & target vision
Which questions should be answered? Which KPIs are critical?
Architecture & data model
Selecting the right platform (e.g. classic DWH vs. lakehouse), defining the data model.
Implementation & ETL
Building pipelines, data processing, first reports & dashboards.
Roll-out & enablement
Training users, self-service rules, governance & continuous optimisation.